
John Vinson and I had an interesting conversation on how to visualize the collaboration and research focus among labs on our drive back from Atlanta. One idea is to classify labs based on similarity in research focus. We can look at the journals each lab published in, assuming that people publish in the same journal share more similar research interests. Another idea is to look at the collaboration structure. We can examine the number of coauthored paper each faculty have with another faculty. This blog post will be about the first idea. John will write a guest blog on the collaboration network. Stay tuned!
I compiled the journals each faculty at Odum School of Ecology published in for their last 40 papers (or all papers if he/she has fewer than 40 publication). The data can be accessed here. Both first author and coauthor papers are included. The first source of data is the updated CV. If a CV is not updated or not available, I extract data from the publication section of the lab website. If the website is not updated or not available, I consult to the Google Scholar page of the faculty. With these three data sources, I compiled data for 32 faculties.
I did a principal component analysis. This is similar to a principal component analysis of community composition. Each faculty is a community. The community composition of each faculty is the number of articles (just like abundance) published in each journal (just like species). The figure below shows how the faculty spread out in the two dimensional space of the first and second principal components. The right panel zooms in the center of the left panel. From the graph, there are at least two, maybe three, research focus groups. The left fork are mostly stream ecologists and the right fork has many disease ecologists.
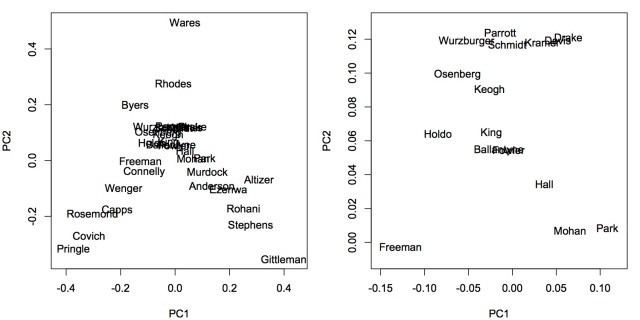
There are 291 different journals in the data set. Plotting them all in biplot will make it extremely difficult to read. Thus, I only plotted the few that dominate the classification of faculties. Freshwater Biology, Freshwater Science, Ecology and Evolution, PloS One, and Proceedings of the Royal Society of London B are the most influential ones. It is worth mentioning that faculties at Odum School publish in many different journals. The first two principal components explained only about 27.16% of total variance. Thus, they do not fully separate research interests. The clusters in the center can be separated more with more principal components.
![]()
The R code for the analyses and figures are shown below.
data = read.csv("OSE_faculty_journal.csv", header=T)

combine = as.data.frame(table(data[,1]))
for (i in 2:dim(data)[2]){
	current = as.data.frame(table(data[,i]))
	combine = merge(x=combine, y=current, by="Var1", all.x=T, all.y=T)
}
names(combine) = c("Journal", names(data))
combine = combine[combine$Journal!="",]
combine.t = as.data.frame(t(combine[,-1]))
names(combine.t) = combine$Journal
combine.t[is.na(combine.t)] = 0

pca = prcomp(combine.t)

quartz(w=8,h=4)
par(mfrow=c(1,2), mar=c(4,4,1,1), oma=c(0,0,0,0))
plot(I(pca$x[,2]/pca$sdev[2]/sqrt(32))~I(pca$x[,1]/pca$sdev[1]/sqrt(32)), col="white", xlab="PC1", ylab="PC2", xlim=c(-0.45,0.45))
text(x=pca$x[,1]/pca$sdev[1]/sqrt(32),y=pca$x[,2]/pca$sdev[2]/sqrt(32),labels=row.names(combine.t), cex=0.65)
plot(I(pca$x[,2]/pca$sdev[2]/sqrt(32))~I(pca$x[,1]/pca$sdev[1]/sqrt(32)), xlim=c(-0.15,0.15),ylim=c(-0.01,0.13), col="white", xlab="PC1", ylab="PC2")
text(x=pca$x[,1]/pca$sdev[1]/sqrt(32),y=pca$x[,2]/pca$sdev[2]/sqrt(32),labels=row.names(combine.t), cex=0.65)

quartz(w=4,h=4)
par(mfrow=c(1,1), mar=c(4,4,1,1), oma=c(0,0,0,0))
plot(I(pca$x[,2]/pca$sdev[2]/sqrt(32))~I(pca$x[,1]/pca$sdev[1]/sqrt(32)), col="grey", xlab="PC1", ylab="PC2", xlim=c(-0.45,0.45), ylim=c(-0.45,0.55), pch=19)
#Freshwater Science#
arrows(0,0,sd(combine.t[,70])*pca$rotation[70,1]/pca$sdev[1],sd(combine.t[,70])*pca$rotation[70,2]/pca$sdev[2], length=0.1,angle=20,lwd=1.5)
#Freshwater Biology#
arrows(0,0,sd(combine.t[,63])*pca$rotation[63,1]/pca$sdev[1],sd(combine.t[,63])*pca$rotation[63,2]/pca$sdev[2], length=0.1,angle=20,lwd=1.5)
#Proceedings of the Royal Society of London B#
arrows(0,0,sd(combine.t[,19])*pca$rotation[19,1]/pca$sdev[1],sd(combine.t[,19])*pca$rotation[19,2]/pca$sdev[2], length=0.1,angle=20,lwd=1.5)
#PloS One#
arrows(0,0,sd(combine.t[,17])*pca$rotation[17,1]/pca$sdev[1],sd(combine.t[,17])*pca$rotation[17,2]/pca$sdev[2], length=0.1,angle=20,lwd=1.5)
#Ecology and Evolution#
arrows(0,0,sd(combine.t[,62])*pca$rotation[62,1]/pca$sdev[1],sd(combine.t[,62])*pca$rotation[62,2]/pca$sdev[2], length=0.1,angle=20,lwd=1.5)

Chao–awesome analysis. very interesting!J Jeb
LikeLiked by 1 person
Thanks very much for this view of our connectivity! Chao, is there interest (and time) in doing a similar analysis of graduate student publications? As a crowd sourcing activity you might get some help from current and recent students? Alan
LikeLiked by 1 person
That is a great suggestions, Alan! I have been thinking of doing something along those lines. Crowd sourcing is one way to do it. In addition, I am learning how to access Google Scholar data through API so I can do these sort of analyses more automatically.
LikeLike
Chao, it would be a great way to document our program during our 50/10 anniversary and set up a baseline of connectivity for the future. The results would also be helpful as we plan for additional new faculty and joint appointments on campus.
LikeLike